file (DJIA-AU)
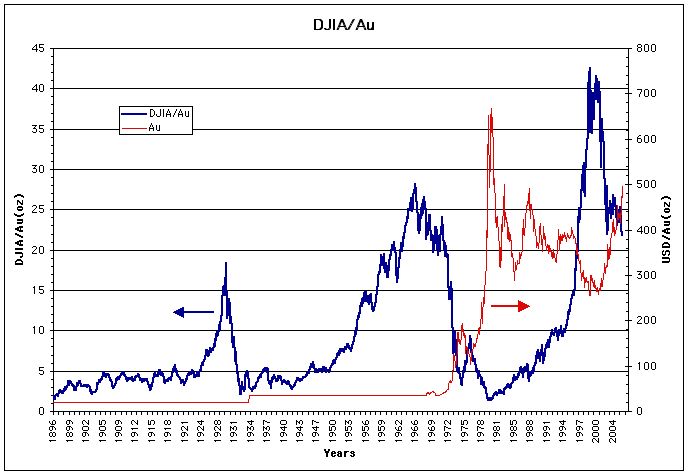
During a trade show, a speaker showed a graph that caught my attention. It showed the price of the Dow-Jones Industrial average valued in Gold (Troy ounces)(DJIA/AU). this means how many troy ounces are needed to buy the index. I came home and recreated that graph with information I obtained from the web. Here is what it looks like.
It can be observed form the previous graph that DJIA/AU has a baseline around 2 or 3 Troy ounces of Gold. Also there has been times where the value of the DJIA has departed this trend line to gain significant heights.
The first time this happened was in 1928, and we know what happened at the time. The market corrected itself in the biggest stock market crash in history. The second time occurred in 1963 and the market corrected itself to the baseline with the highest inflation found in the USA and the price of Gold reaching $850/oz.
In 2000, The third time the DJIA reached its highest point and Gold hitting the lowest valuation at US$264/oz since its high. From this point this graph is correcting itself, When the DJIA has maintained its relative value and Gold increasing to more than US$510/oz today. If Gold closes above US$520/oz by the end of the year we know that it will continue to climb.
If history repeats itself, as we all know it will, the DJIA should have a breakdown and the price of Gold will skyrocket.
There are several criteria that can be estimated to determine the future value of Gold.
The first criteria is the value necessary to make the graph return to the baseline.
a) On the extreme, if DJIA keeps its valuation al 10,000, then Gold must go as high as USD$5,000.00 oz. This is a worst case scenario and we find it difficult to be a realistic approximation. Nevertheless it sets an upper bound.
b) The following table contains valuations of Gold for different values of the DJIA as it corrects itself. For example, If the DJIA corrects itself 50%, it will place its value at 5,000 points, then Gold should go as high as USD$2,500.00 oz. We see this scenario likely to happen in the following 5 years.
|
|
|
|
|
|
|
|
|
|
|
|
|
|
|
|
|
|
|
|
|
|
|
|
The amount of money in circulation M3 in the USA in 2005 is approximately USD$9.6 trillion. In Europe the equivalent is 8.3 trillion Euros that at an exchange rate of 1.18 is equivalent to USD$9.794 trillion. So just in these two currencies there is an equivalent of close to USD$20 trillion (paper). We know there is more money in circulation in the world but these two currencies hold the key positions. It is estimated that the total circulation is about $60 to $70 trillion dollars.
Based on data form the World Gold Council the best estimate available suggest that the total volume of Gold ever mined up to the end of 2002 was approx. 147,000 tonnes, of which 60% was mined since 1950. This corresponds to 4,726,688,103 oz or a cube of 19.67m on a side; actually a small amount. In another estimate form Discovery channel the amount of Gold ever mined is estimated to be a cube of 18 m on a side; which corresponds to 112,557.6 tonnes.
According to a study published by Beacon Advisers in 2002 The amount of Gold resources were about 1,227 million oz that is 38,000 tonnes. At the current production rate it would last 15 years; However, in practice this number is fairly constant because there is new exploration made to replace the resources exploited.
The average mining cost per ounce in 2002 was around USD$235.00 plus USD$40 per ounce to cover for exploration and head office costs. While the grade can vary form high grade of 8-10g/tone to low grade at 3-4 g/tone, being the average at 4-6 g/tone.
In December 2005 the amount of Gold held by different countries reported by the Gold World Council is:
|
Holder |
|
|
GWC Total Ever Mined |
|
|
Discovery channel |
|
|
Total World Holdings |
|
|
All Countries |
|
|
Largest Holders |
|
|
USA |
|
|
Germany |
|
|
IMF |
|
|
France |
|
|
Italy |
|
|
Switzerland |
|
|
Japan |
|
|
ECB |
|
|
Netherlands |
|
|
China |
|
|
Spain |
|
|
Taiwan |
|
|
Portugal |
|
|
Russia |
|
|
India |
|
|
Venezuela |
|
|
United Kingdom |
|
|
Austria |
|
|
Lebanon |
|
|
Belgium |
|
This means that in circulation there is sufficient amount of Gold in various forms, coins, jewelry, electronics, among others.
Regarding the amount of Gold in circulation it is estimated that there is 1 trillion dollars in Gold, which banks hold half. If the paper standard was to be discarded, in the extreme, then Gold should go up to a valuation 20 times higher than the current valuation. This is Gold at USD$10,000.00 !!! this sets an upper bound.
Price of Gold = $20 trillion dollars[31.1035(g/oz)/(2*30,988,000,000g)] = USD$10,037.27/oz
if we compute this value with the total amount of Gold ever mined
Price of Gold = $20 trillion dollars[31.1035(g/oz)/(147,000,000,000g)] = USD$4,231.77/oz
To make the comparison more realistic we would need to include other currencies and the corresponding metals that represent wealth such as silver and platinum. Nevertheless the numbers presented constitute an upper bound on Gold. If Gold reaches these values then madness of crowds would be in control.
Another approximation comes in an article by John Hathaway (http://www.usaGold.com/gildedopinion/Hath-Numeraire.html) these numbers come up as follows
"However, let's assume that the truism is essentially correct. That works out to 140,000 tonnes, which in turn equates to a market cap of $1.5 trillion. Only a small part of that total is represented by monetary Gold. Using highly conservative assumptions, monetary Gold including coins, bars, and quasi jewelry and central bank reserves account for perhaps 50% of this total. The remainder, which exists in the form of Rolexes, museum artifacts, Gold leaf on frescoes, and tooth fillings, is not in play for the sake of this discussion. Neither is most of the central bank Gold. However, for discussion purposes only, let's assume that it is. Based on this reasoning, the market cap of financial Gold, assuming a $400 price, is a paltry $750 billion. .......The market cap of Gold today at $750 billion seems pitifully small when measured against world financial assets of $60 to $70 trillion.
if all assets were to be traded in Gold then the price should be -> USD$15,551.75/oz
As you can see this number is in the same magnitude as the ones considered above. To make it more significant we would have to include the other metals that are identified as wealth such as silver, and platinum.
Regardles of the value in US dollars, it is important to note the real value of Gold; this because it has been used throughout history as a method of payment. Since biblical times, during the roman empire, and up to the present, the value of Gold is roughly equivalent to 350 large loafs of bread per ounce of Gold. This value can be verified through different sources and remains approximately constant through out time.
So if the the value of the dollar were to fall, the humans will go back and use Gold as a means of exchange. Let the dollar do whatever it likes, Gold keeps the true value of goods.